How to Set Up Prometheus Monitoring for Your Kubernetes Cluster
Kubernetes has become the de facto standard for container orchestration, and as applications grow in complexity, monitoring their performance becomes crucial. Prometheus is a powerful, open-source monitoring and alerting tool designed specifically for dynamic, cloud-native environments like Kubernetes.
This guide walks you through how to set up and use Prometheus to monitor your Kubernetes cluster effectively.
So let’s get started.
What is Prometheus?
Prometheus is an open-source system monitoring and alerting toolkit designed specifically for dynamic cloud environments like Kubernetes. It collects metrics from configured targets at specified intervals, evaluates rule expressions, and triggers alerts when certain conditions are met.
Prometheus is particularly well-suited for Kubernetes because of its ability to scrape metrics from pods, nodes, and services without requiring significant configuration changes.
Why Use Prometheus for Kubernetes Monitoring
Prometheus is highly scalable and efficient for monitoring Kubernetes clusters.
- Multi-dimensional data model: Organizes metrics with key-value pairs for flexible querying.
- Powerful query language (PromQL): Enables in-depth metric analysis.
- Service discovery: Automatically detects services in dynamic environments like Kubernetes.
- Custom alerts: Triggers alerts based on predefined conditions.
- Integration support: Works seamlessly with Grafana for advanced visualization.
What is kube-prometheus-stack?
The kube-prometheus-stack is a comprehensive collection of Kubernetes manifests, Helm charts, and configurations designed to provide a ready-to-use monitoring stack for Kubernetes clusters. It includes Prometheus, Grafana, Alertmanager, and other tools necessary for monitoring and alerting. This stack simplifies the process of setting up and managing monitoring systems in Kubernetes environments.
Key features of kube-prometheus-stack include:
- Out-of-the-box monitoring: Pre-configured dashboards and alerts for Kubernetes components, nodes, and workloads.
- Scalability: Supports horizontal and vertical scaling to handle large clusters.
- Customizable configuration: Easily adaptable to specific needs using Helm values.
- Easy installation: Deploys with a single Helm command, reducing setup complexity.
By using kube-prometheus-stack, you can quickly deploy a robust monitoring solution that integrates seamlessly with your Kubernetes cluster.
How to set up service monitoring using Prometheus?
Let’s explore the essential steps to set up service monitoring with Prometheus, ensuring real-time insights and proactive issue resolution for your applications.
Prerequisite:
- A Kubernetes cluster should be spinned up.
- Ensure you have a running Kubernetes cluster.
- Install kubectl to communicate with your cluster. Installation Guide
Install helm. Installation Guide
Step 1 – Install kubectl
Follow the installation instructions at Kubernetes kubectl documentation to set up ‘kubectl’, which is necessary for communicating with your Kubernetes cluster.
Step 2 – Install Helm
Helm is required for managing Kubernetes applications. Install it using the instructions available at Helm installation guide.
Step 3 – Add the Prometheus Community Helm Repository
Add the Prometheus Helm repository and update your Helm repos with the following commands:
Step 4 – Install Kube-Prometheus-Stack
Create a dedicated namespace for service monitoring and install the Prometheus chart:
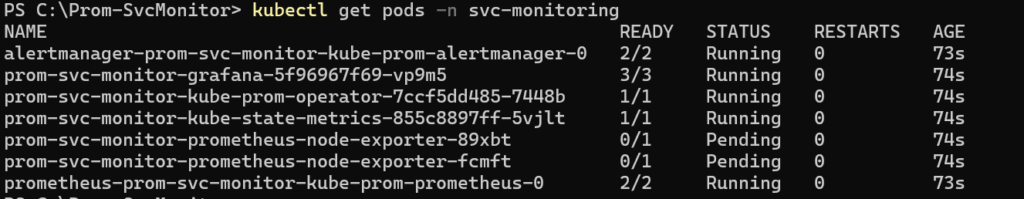
Step 5 – Verify Installation
Confirm that the Kube-Prometheus-Stack has been installed by checking the installed resources:
Step 6 – Configuring a Service Monitor
a. Deploy Sample Application Pod and Service:
Before configuring the Service Monitor, deploy a sample application pod and service. Use the ‘deployment.yaml’ and ‘service.yaml’ files for an example application called “myapp”.
deployment.yaml
service.yaml
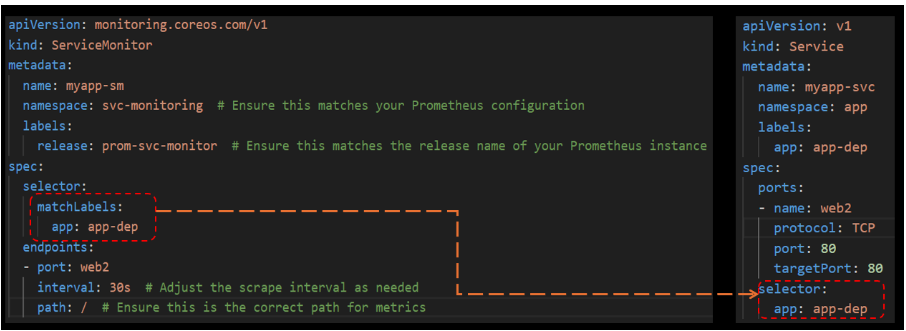
b. Create a Service Monitor:
Configure a Service Monitor to scrape metrics from the sample application. Ensure the following settings:
- Metadata Labels: The labels should include a release name that matches the Helm chart release name, in this case, “prom-svc-monitor.”
- Selector Match Labels: The selector should match the labels in your service.yaml.
- Metric Path: Ensure that the metric path is correctly set.
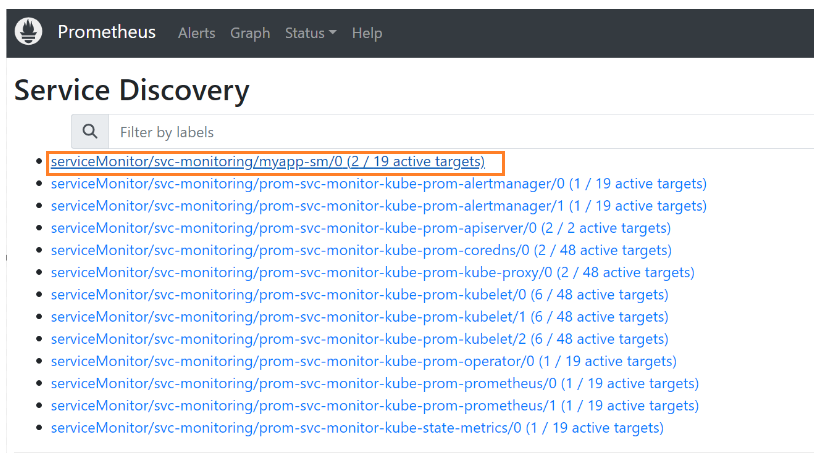
c. Confirm Service Monitor Communication:
Ensure the Service Monitor can communicate with the service by verifying the logs and checking if Prometheus is scraping the metrics.
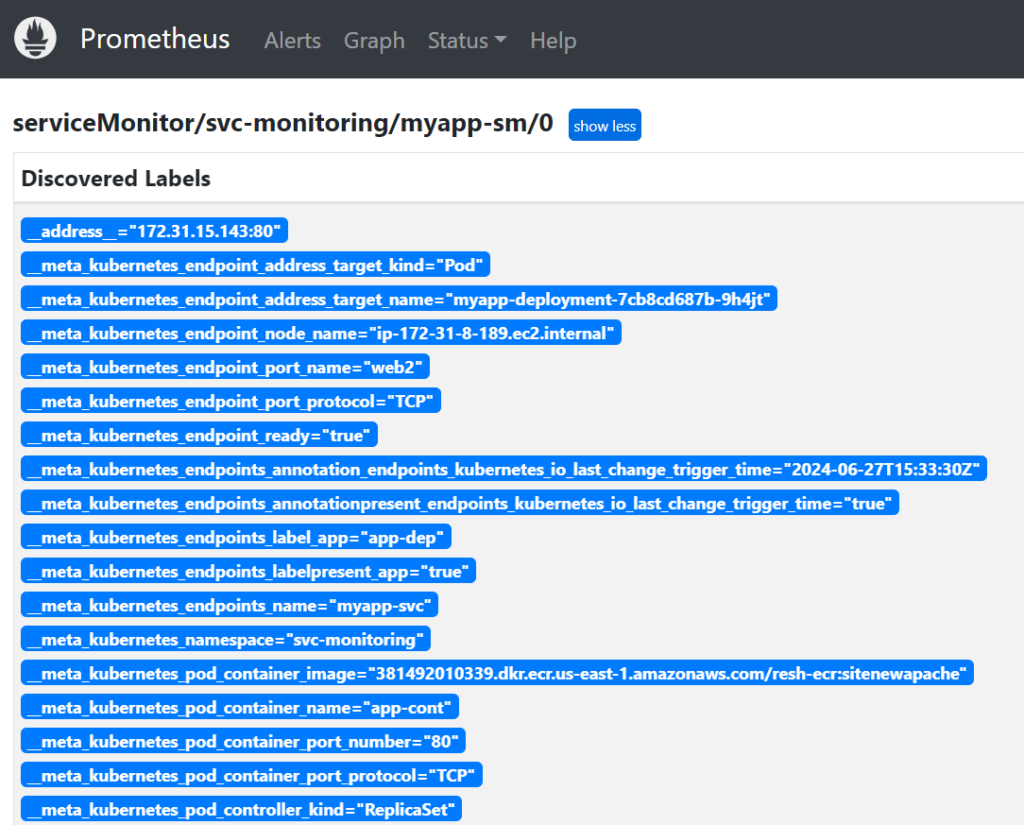
d. Verify Metrics Collection:
Prometheus should now begin collecting metrics. You can confirm this in the Prometheus dashboard. Prometheus dashboard can be exposed by port-forwarding the service “prom-svc-monitor-kube-prom-prometheus”. Access the Prometheus dashboard by port-forwarding the Prometheus service:
Elevate Your Kubernetes Monitoring Strategy with Prometheus
In this blog, we’ve demonstrated how to set up service monitoring in a Kubernetes environment using Prometheus and the kube-prometheus-stack Helm chart. We configured a Service Monitor for an application. Using these tools and techniques, you can efficiently monitor your services, ensuring they remain highly available and perform efficiently.
Ready to elevate your organization’s performance with Kubernetes? Contact Stackgenie today to discover how our Prometheus consulting services can fuel innovation and optimize operations.
Frequently Asked Questions
1. Why should I use Kube-Prometheus-Stack in my Kubernetes cluster?
Kube-Prometheus-Stack provides a comprehensive monitoring solution with minimal setup, allowing you to monitor the performance, health, and resource usage of your Kubernetes workloads.
2. What are the prerequisites for setting up Kube-Prometheus-Stack?
You should have a running Kubernetes cluster, Helm installed on your local machine, and appropriate permissions to deploy resources on the cluster.
3. Can I customize the Kube-Prometheus-Stack deployment?
Yes, you can customize the deployment by modifying the values.yaml file or passing custom values during the Helm installation to tailor the deployment to your needs.
4. How do I upgrade or uninstall Kube-Prometheus-Stack?
You can upgrade the stack using the helm upgrade command and uninstall it using the helm uninstall command, specifying the release name of your deployment.